Testing Claude Dashboards: a market dashboard from 45 FRED series in 20 minutes
I tried the new Claude Dashboards feature on rates, labor, credit, housing, and investment data. The numbers were interesting, but the workflow is the real story.
What I built
I decided to test out the new Claude Dashboards feature. I built a market dashboard from 45 FRED series covering rates, labor, credit, housing, and investment, then used AI to help me read it.
What jumped out
Rates and markets
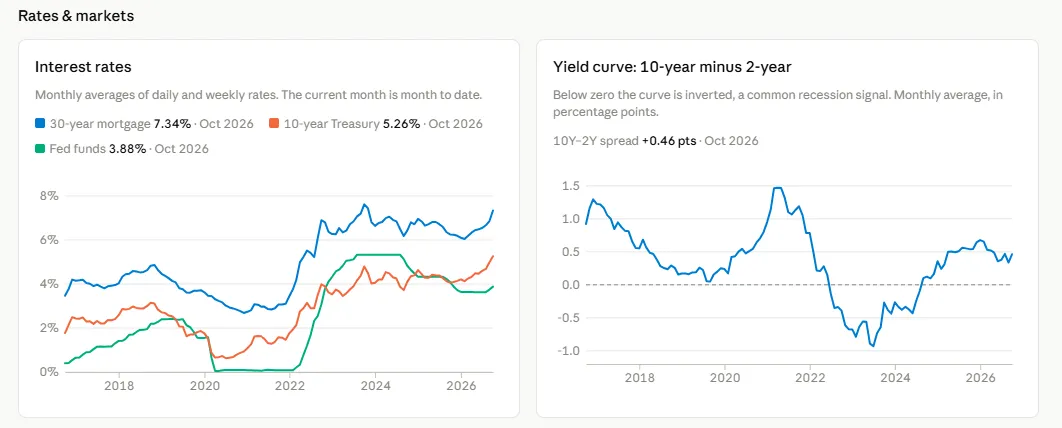
- Rates: The 10-year Treasury is averaging 5.26% this month, up from 4.06% a year ago and nearly 140 bp above fed funds (3.88%). The 30-year mortgage is at 7.34%.
- The Fed: Unemployment is low at 4.2% and inflation is running 3.35%, so the Fed hiked in September rather than cutting.
Labor
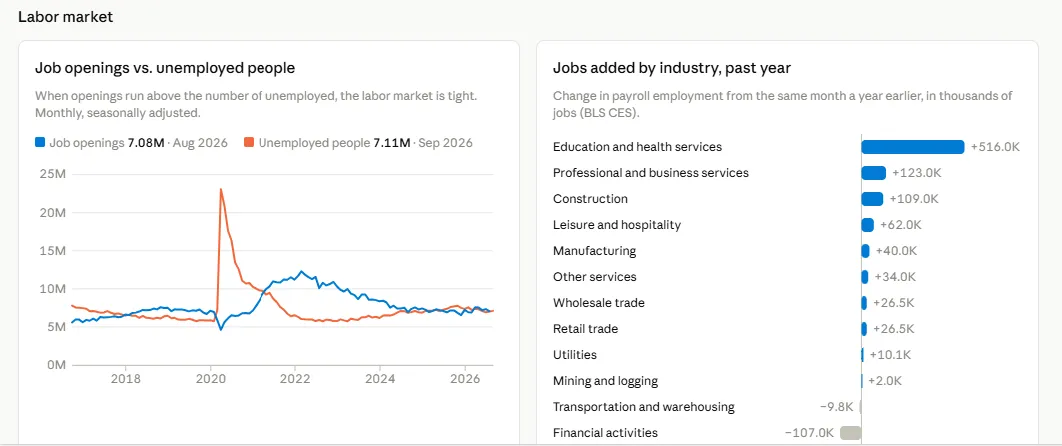
- Jobs: Openings (7.08M) and unemployed people (7.11M) are now roughly even. Education and health added the most jobs over the past year (+516K).
Credit, CRE, and growth
- CRE credit: Bank CRE delinquency has leveled off at about 1.5% after rising since 2022.
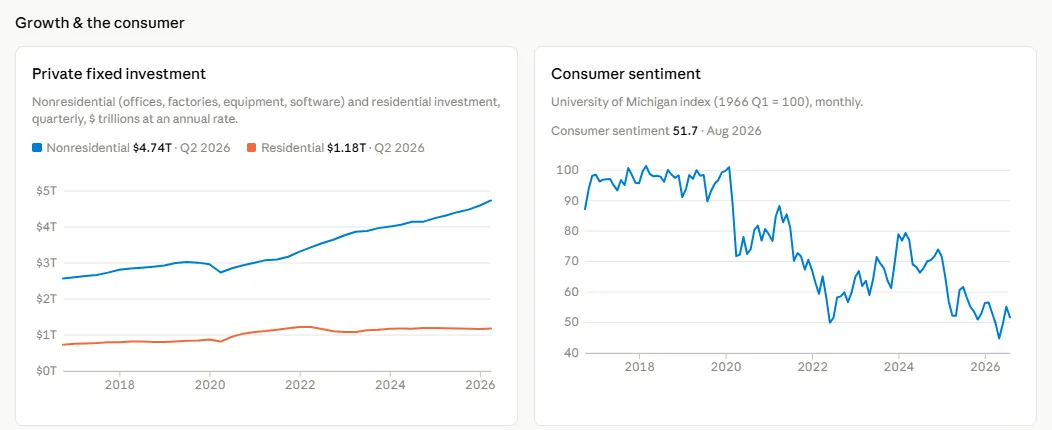
- Investment: Nonresidential investment is up 9.6% year over year, likely driven by data centers, while residential is down.
- Consumers: Sentiment is weak, at 51.7 on the University of Michigan index.
The real story is the workflow
What used to be hours of manual FRED downloads and chart rebuilding took about 20 minutes, plus AI turning the numbers into a first-draft narrative an analyst can edit. For exploration and one-off analysis, that’s faster than any Power BI or Sigma report I’ve built.
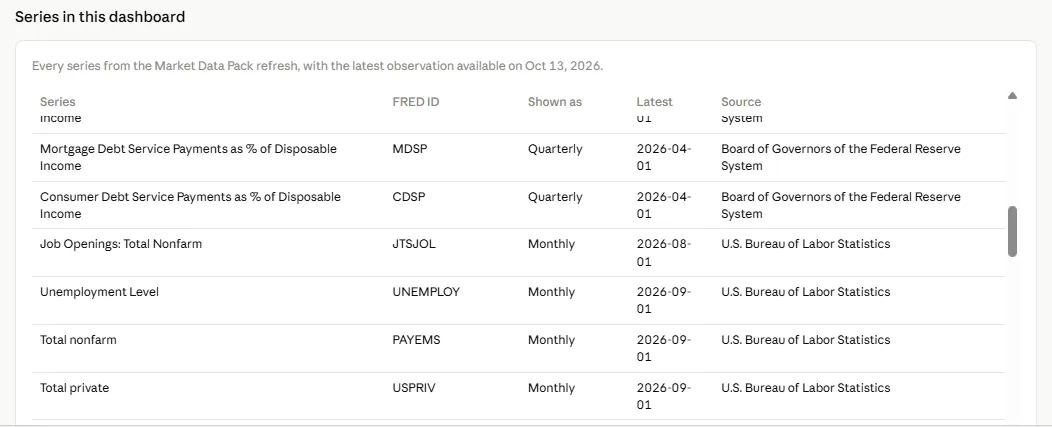
The dashboard also lists every series it uses, with each one’s FRED ID, frequency, latest date, and source, so it’s easy to check where a number came from.
What I’m still curious about
- What other variables would you add to look for relationships?
- How will people actually use these tools to find insights, and how do we keep a fast dashboard from becoming a fast wrong answer?
- Is this mostly quicker reporting, or can it support sophisticated analytics?
If you’re in CRE research and still pulling data by hand, I’d love to compare notes.